Sugar free: Porting the exact `ggplot2` syntax to Python is not important
23 August, 2026
Preamble
WHEREAS the R package ggplot2 is a revolution for declarative, composable data science graphics,
WHEREAS the Python plotting ecosystem is dominated by imperative, stateful APIs for plotting like matplotlib,
WHEREAS Python packages like seaborn, plotnine, and lets_plot have aspired to reimplement the "grammar of graphics" that forms the design basis of ggplot2 code,
I will assert that copying the exact syntax of ggplot2 in Python is not an important thing to do and causes headaches for users.
These packages have done great work to bring the grammar of graphics to Python.
Python users can reap these benefits just fine while deviating from the exact syntax.
ggplot2 in R
The design basis of ggplot2 is a "grammar" that decomposes a graphic into orthogonal expressions that can be composed to achieve a variety of graphical creations.
These orthogonal expressions describe:
- data: a table where columns are located (and identifiable by name)
- aesthetic mapping: an association between columns in the data and visual dimensions of the graphic, including coordinate axes (x, y), colors, sizes, transparency, and so on.
- geometric representations of quantities: points, lines, bars, areas...
and so on. If you are reading this post, I assume you are already familiar with this.1
As it happens, the literal syntax of the ggplot2 R package works by combining these expressions into a total plot by "adding" them with the + operator.
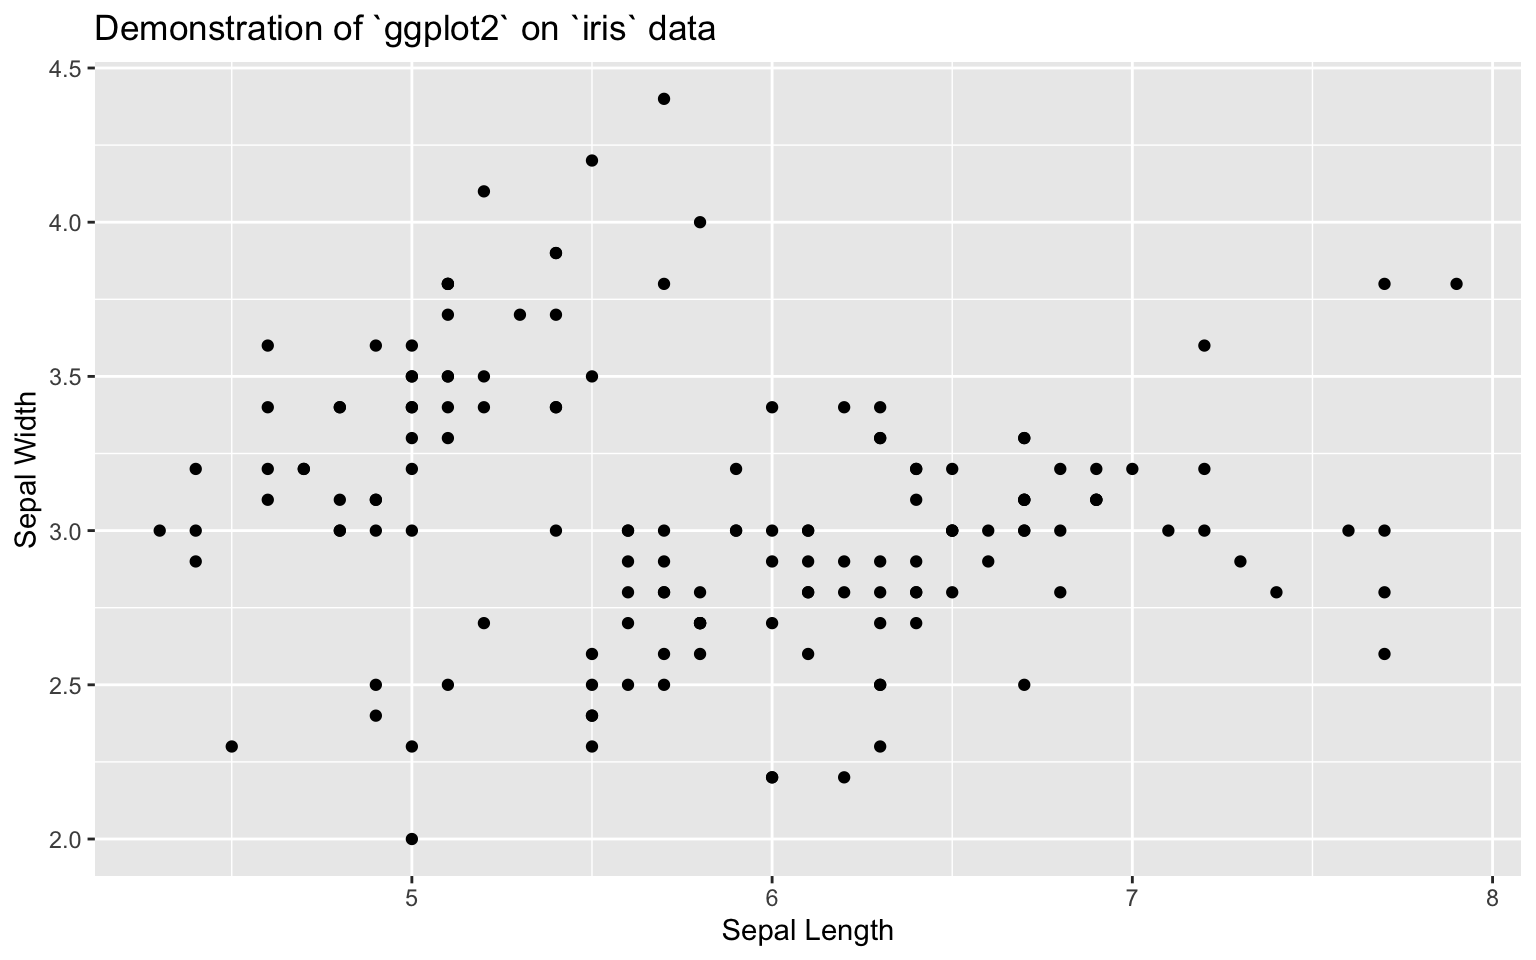
Your obligatory example:
library(ggplot2)

ggplot(data = iris) +
    aes(x = Sepal.Length, y = Sepal.Width) +
    geom_point() +
    labs(
        title = "Demonstration of `ggplot2` on `iris` data",
        x = "Sepal Length",
        y = "Sepal Width"
    )
I am specifically singling out the addition of expressions: a + b + ... + z.
This is how it is done in R.
It works fine in R.
Python, however...
In Python
We will use plotnine as our ggplot2 port in Python.
import plotnine as pnThe addition of expressions a + b + ... + z is painful in Python because Python has a different set of rules for significant whitespace.
In R, if one line of code doesn't terminate an expression, the interpreter will continue interpreting future lines until the statement ends or errors.
In Python, a single line of code must terminate the expression (unless other steps are taken).
For example, this plot fails if it is written like typical R code, because the lines ending with + are incomplete and raise a syntax error.
pn.ggplot(data = r.iris) +
    pn.aes(x = "Sepal.Length", y = "Sepal.Width") +
    pn.geom_point() +
    pn.labs(
        title = "Python `plotnine` example",
        x = "Sepal Length",
        y = "Sepal Width"
    )
## invalid syntax (<string>, line 1)
You must either line-break with \ to tell the Python interpreter to keep the expression open...
pn.ggplot(data = r.iris) + \
    pn.aes(x = "Sepal.Length", y = "Sepal.Width") + \
    pn.geom_point() + \
    pn.labs(
        title = "Python `plotnine` example",
        x = "Sepal Length",
        y = "Sepal Width"
    )
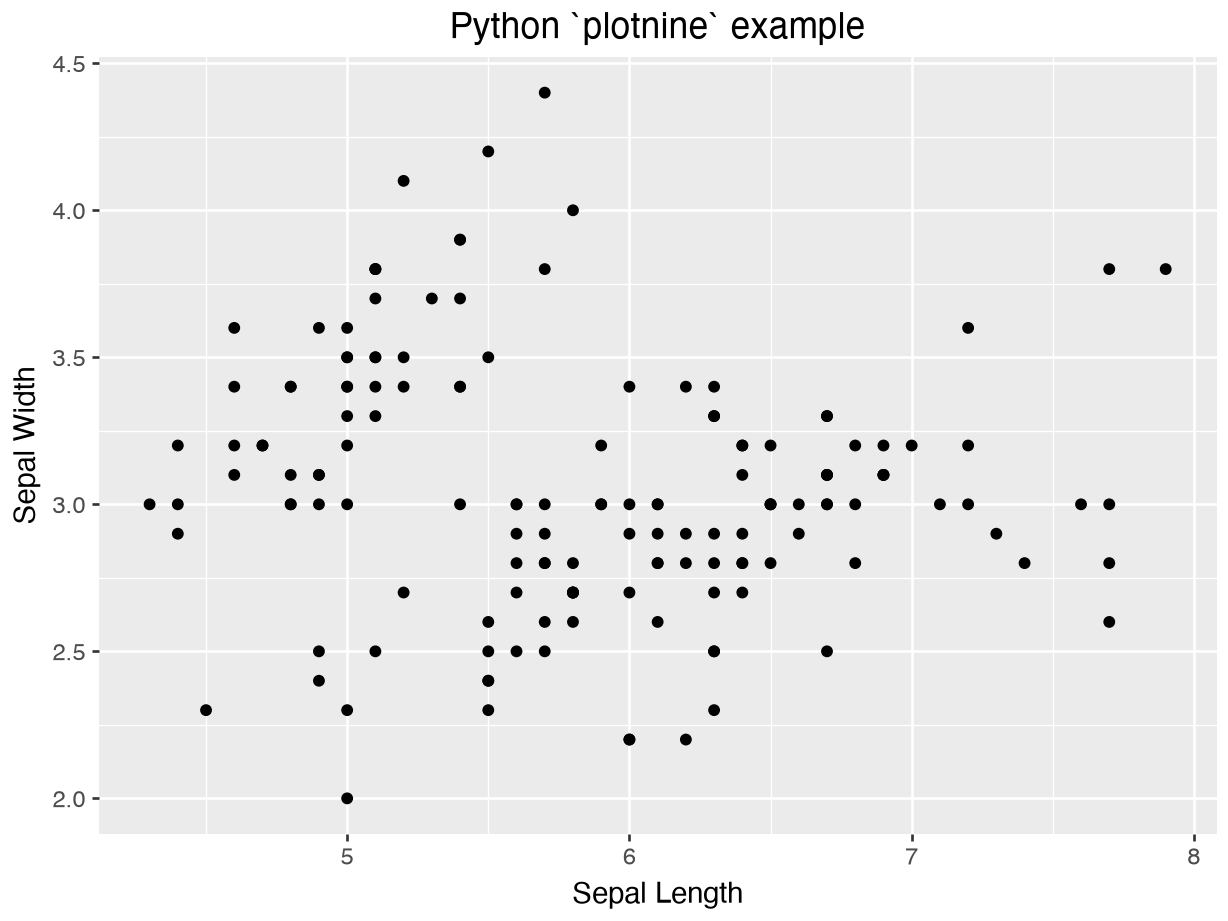
...or you can scope the expression with parentheses.
(
    pn.ggplot(data = r.iris) +
        pn.aes(x = "Sepal.Length", y = "Sepal.Width") +
        pn.geom_point() +
        pn.labs(
            title = "Python `plotnine` example",
            x = "Sepal Length",
            y = "Sepal Width"
        )
)
This syntactic pain also appears when chaining dataframe transformations with polars.2
# using parens to keep the expression alive across lines
result: pl.DataFrame = (
    df
    .with_columns(...)
    .filter(...)
    .groupby(...)
    .agg(...)
    .sort(...)
)
When you just want to type some code,3 both of these syntactic quirks are annoying. I am not saying that R is "better" than Python in this regard. It's just a difference. To play devil's advocate, here is some perfectly valid but horrendous R code.
1 +


# ayyy lmao

         1
## [1] 2
So you can see that R isn't some paragon of syntactic hygiene by any means.
Functions, not syntax
My argument here is mainly that the + operation is truly irrelevant to the broader project of porting ggplot2 ideas into Python.
The syntax that works in R does not work in Python without workarounds.
So what value is there in porting the exact syntax to Python, really?4
Watch as we make syntax a non-issue while keeping the important grammar components consistent.
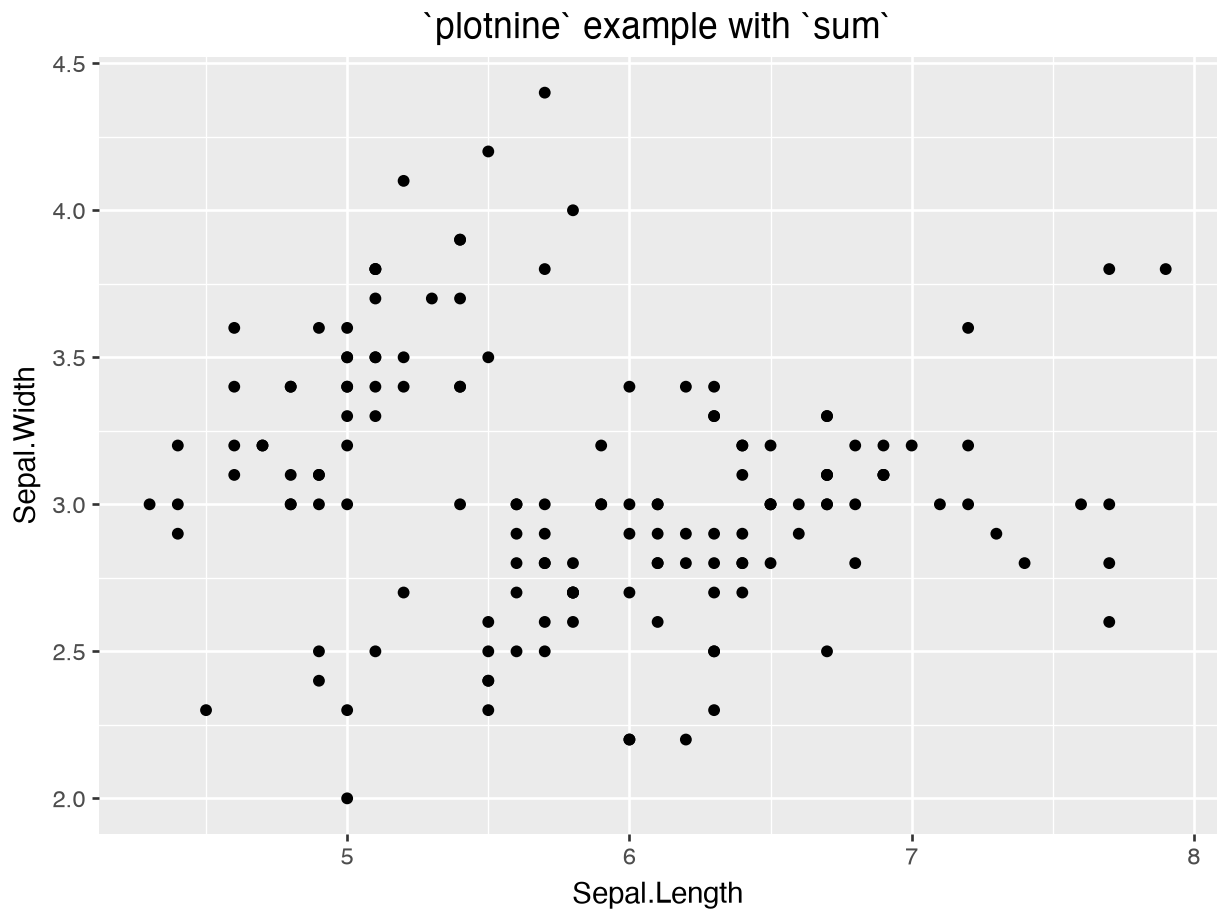
We will do it by thinking functionally. What is the function that adds a bunch of things? Sum.
sum(
    [
        pn.aes(x = "Sepal.Length", y = "Sepal.Width"),
        pn.geom_point(),
        pn.ggtitle("`plotnine` example with `sum`")
    ],
    start=pn.ggplot(data = r.iris)
)
Sure... this is not the prettiest so far.
It is a little awkward because sum wants to initialize its result with the number 0, so we have to set a different initial value.
But clearly we are getting somewhere.
Here is a trivial function that hides the boilerplate.
def fnplot(data, *components):
    return sum(components, start=pn.ggplot(data = data))
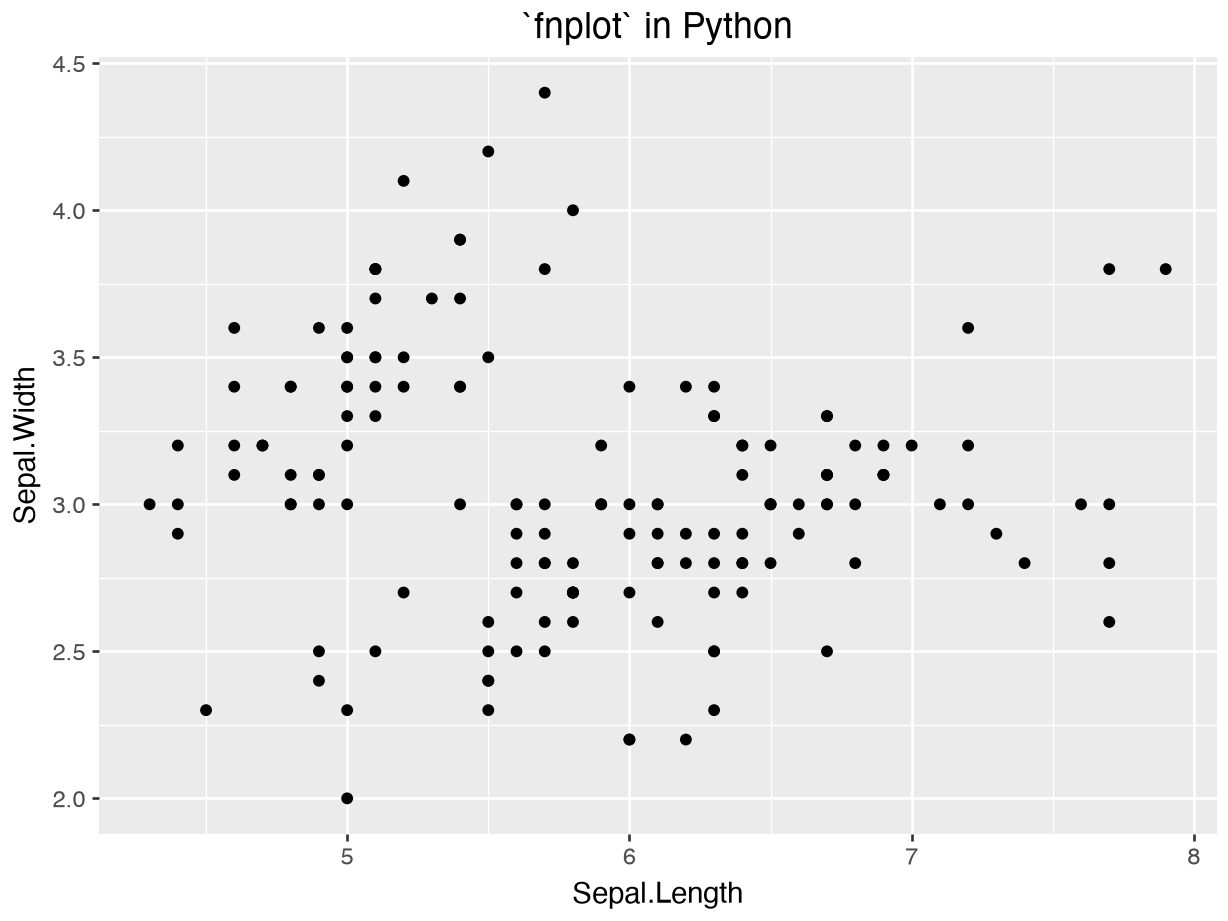
And now here is the feel that we achieve:
fnplot(
    r.iris,
    pn.aes(x = "Sepal.Length", y = "Sepal.Width"),
    pn.geom_point(),
    pn.ggtitle("`fnplot` in Python"),
)
This looks perfectly fine to me.
Readers of ggplot2 code can understand perfectly well what this is doing.
The representation of the "grammar of graphics" is unaffected by our design, yet we have elided all syntactic pain from trying to make Python look like R.
Python doesn't look like R because it isn't R, and that's okay.
Code will write and read better if it's not fighting against the language you are using.
Back to R
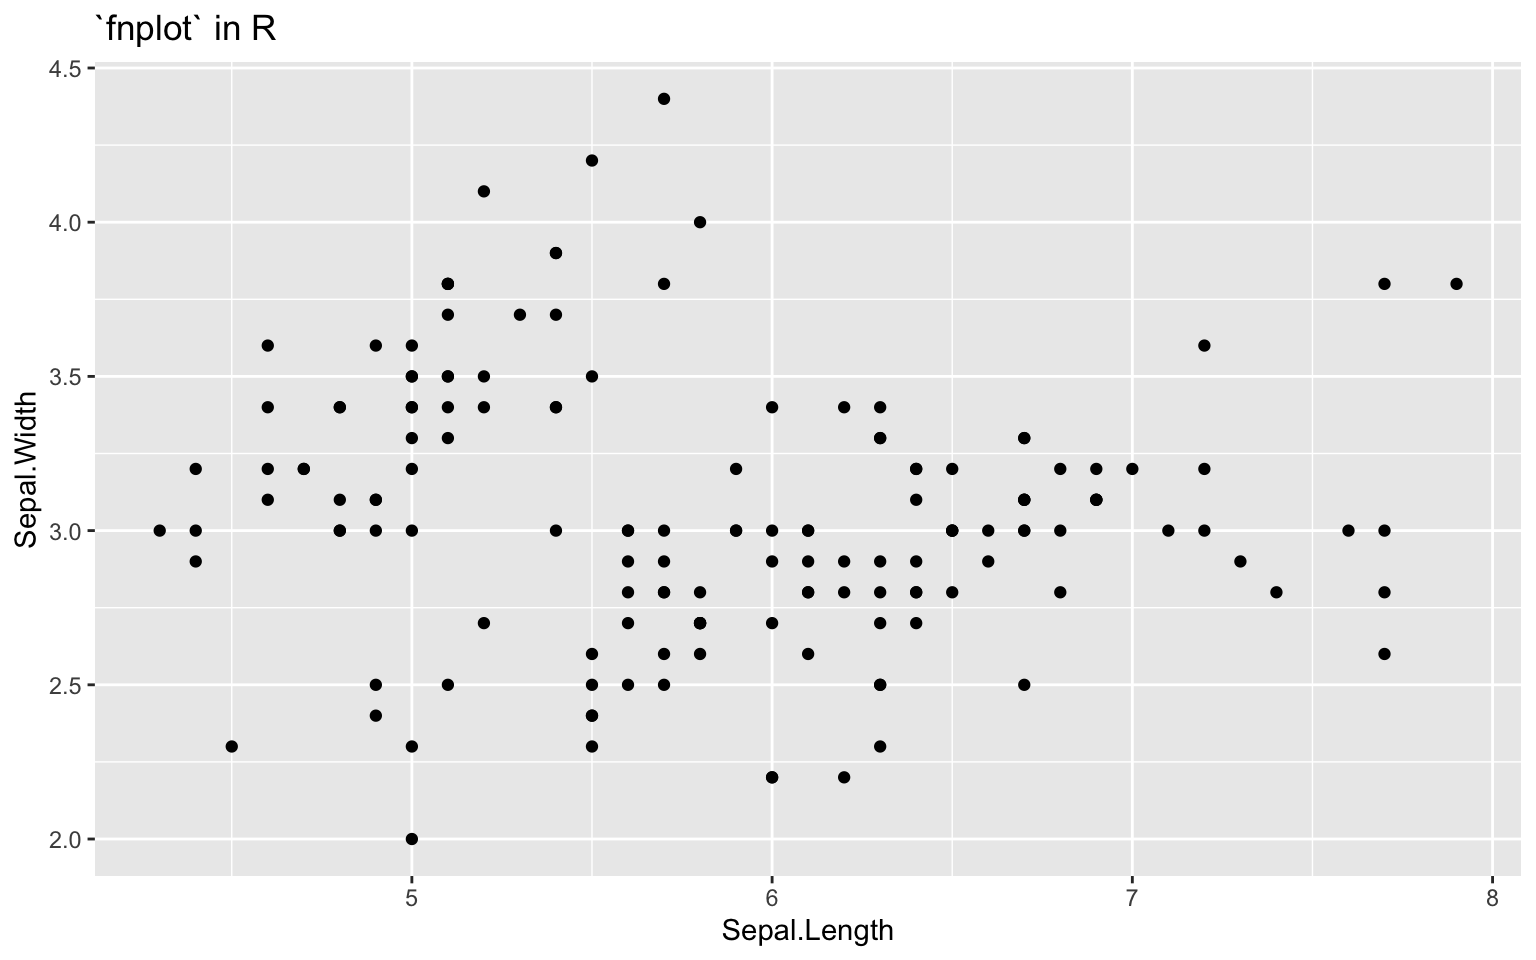
Just to hammer the broader "functions, not syntax" argument here, we can implement this same interface in R too.
The sum function won't work as our implementation layer without extra OOP legwork.
But that's okay; we can use Reduce because we know that (sum x) is functionally equivalent to (reduce + x).
fnplot = function(data, ...) {
    Reduce(`+`, list(...), ggplot(data))
}


fnplot(
    iris,
    aes(x = Sepal.Length, y = Sepal.Width),
    geom_point(),
    ggtitle("`fnplot` in R")
)
When I say "not important"...
Obviously there are pragmatic reasons for these packages to mirror the R syntax. What I am saying, I guess, is that it is sort of unfortunate that we have to take this trade-off.
I am appealing to some sense in which function calls are universal syntax.
Whether it's a C-like language with func(a, b), a Lisp with (func a b), or a meta-language with func a b, these are all the same.
People joke that Lisps are languages that "contain no syntax".
This is not entirely true, but I take the point: I have no idea if any Lisps implement the grammar of graphics, but if any did, we already know how to write the fnplot implementation.
(fnplot
    iris
    (aes :x "Sepal.Length" :y "Sepal.Width")
    (geom_point)
    (ggtitle "`fnplot` in Lisp"))
And this is sort of the whole point with these "Sugar free" blog posts: how often is syntax a problem when the function is no problem?
If not, here is the cheat sheet.
Not coincidentally, the flow of polars syntax is greatly influenced by SQL and R (Tidyverse) code where multi-line expressions are natural for reading a chain of related operations.
I don't know about you, but ggplot-style plotting is one area where it still feels faster to hand-type the code than explain what I want to an LLM agent.
The argument is, of course, that familiarity encourages use.
But expressions like geom_point(size = 2, alpha = 0.5) are where the familiarity actually pays off, and these packages handle that just fine.